카테고리 없음
2024-06-13 랜덤 포레스트
동동순이
2024. 6. 14. 09:10
1.hotel 데이터셋
import numpy as np
import pandas as pd
import matplotlib.pyplot as plt
import seaborn as sns
hotel_df = pd.read_csv('/content/drive/MyDrive/kdt/6. 머신러닝과 딥러닝/데이터/hotel.csv')
hotel_df
필요한 것을 import해주고 파일을 불러온다.
hotel_df.info()
hotel: 호텔 종류
is_canceled: 취소 여부
lead_time: 예약 시점으로부터 체크인 될 때까지의 기간(얼마나 미리 예약했는지)
arrival_date_year: 예약 연도
arrival_date_month: 예약 월
arrival_date_week_number: 예약 주
arrival_date_day_of_month: 예약 일
stays_in_weekend_nights: 주말을 끼고 얼마나 묶었는지
stays_in_week_nights: 평일을 끼고 얼마나 묶었는지
adults: 성인 인원수
children: 어린이 인원수
babies: 아기 인원수
meal: 식사 형태
country: 지역
distribution_channel: 어떤 방식으로 예약했는지
is_repeated_guest: 예약한적이 있는 고객인지
previous_cancellations: 몇번 예약을 취소했었는지
previous_bookings_not_canceled: 예약을 취소하지 않고 정상 숙박한 횟수
reserved_room_type: 희망한 룸타입
assigned_room_type: 실제 배정된 룸타입
booking_changes: 예약 후 서비스가 몇번 변경되었는지
deposit_type: 요금 납부 방식
days_in_waiting_list: 예약을 위해 기다린 날짜
customer_type: 고객 타입
adr: 특정일에 높아지거나 낮아지는 가격
required_car_parking_spaces: 주차공간을 요구했는지
total_of_special_requests: 특별한 별도의 요청사항이 있는지
reservation_status_date: 예약한 날짜
name: 이름
email: 이메일
phone-number: 전화번호
credit_card: 카드번호hotel_df.drop(['credit_card', 'email', 'name', 'phone-number', 'reservation_status_date'], axis=1, inplace=True)
hotel_df
분석에 필요없는것들은 지워준다
hotel_df.describe()
기본값을 확인
sns.displot(hotel_df['lead_time'])

sns.boxplot(hotel_df['lead_time'])

sns.barplot(x=hotel_df['distribution_channel'], y=hotel_df['is_canceled'])

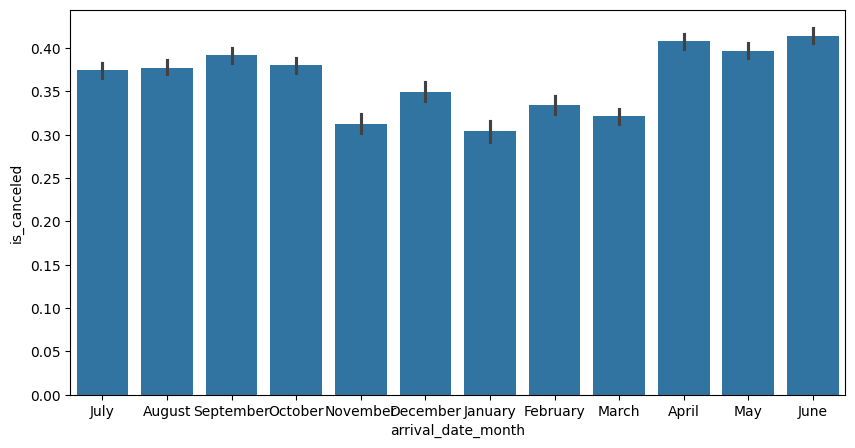
plt.figure(figsize=(10, 5))
sns.barplot(x=hotel_df['arrival_date_month'], y=hotel_df['is_canceled'])
import calendar
print(calendar.month_name[1])
print(calendar.month_name[2])
print(calendar.month_name[3])
print(calendar.month_name[4])
January
February
March
Aprilmonths=[]
for i in range(1,13):
months.append(calendar.month_name[i])
months
['January',
 'February',
 'March',
 'April',
 'May',
 'June',
 'July',
 'August',
 'September',
 'October',
 'November',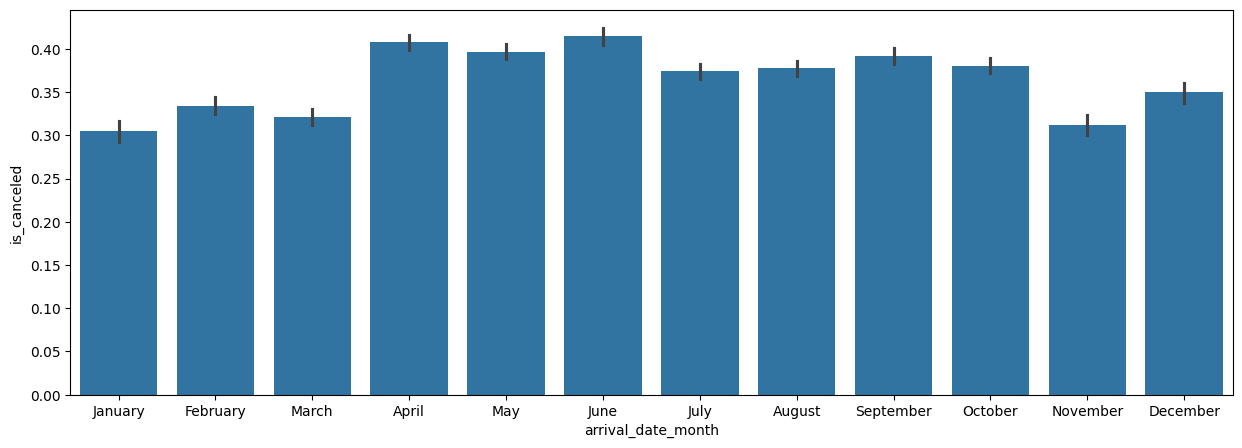
'December']plt.figure(figsize=(15, 5))
sns.barplot(x=hotel_df['arrival_date_month'], y=hotel_df['is_canceled'],order=months)
# corr() : 열들 간의 상관관계를 계산하는 함수.(피어슨 상관계수)
# -1 ~ 1까지의 범위를 가지며 0에 가까울수록 두 변수의 상관관계가 없거나 매우 약함
plt.figure(figsize=(15, 15))
sns.heatmap(hotel_df.corr(numeric_only=True), cmap='coolwarm',vmax=1,vmin=-1,annot=True,)

위와 같은 상관계수표가 나온다.